| Notes on The Periodic Table |   |
Here is a typical representation of the periodic table with the element symbols and the number of electrons in each atom. If we compare this table to the "seating chart" in the last section, we can see some similarities and some differences. There are "blocks" of seats that are two columns wide, others that are 6, 10 and 15. These look suspiciously like the "seating chart." But the arrangement of blocks isn't quite as orderly as they were laid out for the atomic amusement park ride and there are a couple of other weird differences. Let's see how we can match up the experimentally determined table (as shown below) with the model electron "seating chart."
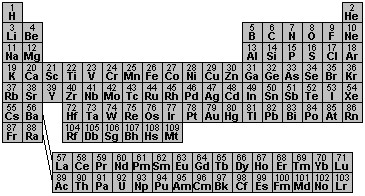
The format of the table above is empirical in that is has been worked out using experimental observations. It's one reasonable way to organize those observations. In this empirical table, the elements are ordered by the number of electrons (or protons) in the atom and are grouped according to their chemical properties. Elements with similar properties are grouped in the columns. As we move along a sequence of elements whose atoms having increasing numbers of electrons, we find that the chemical and physical properties "repeat." For example, chlorine with 17 electrons has similar behavior to fluorine with 9 electrons. Then bromine with 35 electrons has similar behavior to fluorine and chlorine. The physical and chemical properties of the elements depend upon the arrangement of the electrons in the atoms that we started exploring in the last section.
Four distinct blocks of elements can be seen in the table. In the illustration below I have colored them to match the different kinds of seats described in the amusement park ride of the last section: the yellow ones correspond to seats that only go in and out, the red ones whirl around somewhat, and the green seats whirl around more, and the blue ones even more. I have labeled the rows of the table "1st", "2nd", "3rd", and so on. These rows correspond to the levels of the chart as in the previous section. The levels increase as one goes down the table.
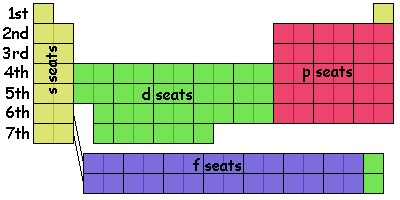
As we saw in our atomic-amusement-park-ride model, each level (row) has a "non-whirling" seat, the one that just goes in and out. The first two columns of the table correspond to the s seats. For historical reasons that I'm not going to go into, those seats are called the "s" seats and are the yellow seats in the chart. (People actually call them "orbitals" rather than "seats" although we know that electrons in these seats really aren't "orbiting" in the sense we are used to. Let's stick with "seats" but realize that chemists and chemistry texts will call them "orbitals.")
The seats that involve some amount of motion whirling about the nucleus get different names. The seats with the least amount of whirling in each level get the label "p." There are three such seats on each level (except the 1st level which has none) and they are red in the illustrations. In the empirical table above they are on the right side of the table which is a little different from the amusement-park-ride chart of last section.
The next set of seats, with five seats on each level and colored green, gets the label "d" and the next, with 7 seats gets the label "f" and the color blue in my illustration. In the empirical table, these blocks are arranged a little Seats with more whirling go in alphabetical order (g, h, ...) , but in to fill out the table we don't worry about anything beyond "f."
Let's do a couple of examples to see just how this works. Let's pick an atom of Cs which stands for cesium. It is in the first column of the sixth row and has 55 electrons. Fifty four of the electrons are in seats filled before the sixth level, and the 55th electron (if we could tell the difference between electrons) is in the s seat of the sixth level. Next, let's pick an atom of calcium, Ca, which is in the second column of the 4th row. It has 20 electrons of which 18 are in seats below the 4th level. The outermost two are in the s seats of the fourth level.
Now look to the far right of the table. The right-most six columns of the table correspond to the p seats (3 seats times 2 electrons per seat). This seating section is sometimes called the "p block." Let's look at an atom of oxygen, O, which has 8 electrons. It's in the second row and in the fourth p seat (which happens to be the 16th column). It has 4 electrons in p seats of the second level. Of the other four electrons two are in the first level s seats and two are in the second level s seats. Now look at helium, He, in the last column of the first row. It looks somewhat out of place there. The seating chart would actually predict it to be right next to hydrogen, H, with two electrons filling its 1st level s seat. Most tables, however, put it at the right side since it shares physical and chemical properties with the elements below it, all of which have completely filled levels. Sometimes helium is shown in both places.
Now let's consider the d seats which have five seats per level and would result in 10 columns. If life followed the amusement-park-ride seating chart outlined in the last section, the d seats would appear in a 10-column block to the right of the p block, starting at the third level (remember levels 1 and 2 don't have p seats). But in the actual table the 10 column d block starts on the fourth level and is placed in the middle of the table! The situation is that the 4s seats get filled before the 3d seats (and 5s before 4d, and so on). The amusement park rides are really somewhat different for each atom, and the seat ordering is different for atoms with lots of electrons. The detailed reasons are too lengthy to cover here. So the middle 10 columns of the periodic table are the d seats and, technically, the d seats in the 4th row are the 3d seats, the d seats in the 5th row are 4d seats and so on. The table reflects actual empirical evidence, and we find that our single atomic-amusement-park-ride model is an imperfect, although useful, way to help understand how things work. As an example, consider iron which has the symbol Fe and 26 electrons. It appears in the 8th column of the 4th row. We can see that since it is in the 6th column of the d block that it has six d electrons, six 3d electrons in fact. We also know that it has all the lower level electrons, two in the 1s seats, two in the 2s seats, six in the 2p seats, two in the 3s seats, six in the 3p, and two in the 4s.
The final section of seats is the f seats. There are 7 f seats per level and with 2 electrons per seat we get 14 columns in the table. As with the d seats, the f seats get filled a little later than their level would predict. The 4th level is the first to have f seats but they don't really get filled up till after the 6s seats have been filled. If we followed the layout used for the d seats, would stick 14 columns to the between the s and d seats:
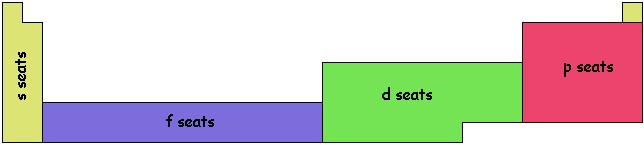
As you can see that makes for a wide table. For convenience, most tables put the f seats below the others. I like to draw lines between the main table and the f seats to remind me of where they go chemically, as shown in the first two illustrations of this section. One column of d seats is attached at the end of the f-seat section. Some people try to squeeze it in the gap between the s and d blocks. As an example, consider uranium, U, the heaviest element found in any significant natural abundance on Earth. It sits in the f seats, in the 4th column of the bottom row. This tells us that it has four electrons in outer f seats as well as 88 electrons filling in the 1s, 2s, 2p, 3s, 3p, 4s, 3d, 4p, 5s, 4d, 5p, 6s, 4f, 5d, 6p, and 7s seats.
Although the actual periodic table is a little different than the atomic-amusement-park-ride seating chart, we can see that it is still essentially a master seating chart. The location of each element gives the location of the last seat filled by the electrons in an atom of the element. Since these outer electrons are the ones that are involved in chemical reactions and bonding, we find that the table gives us quite a bit of predictive power when looking at chemical bonding.
© 2001 bpReid